Zoom Chart Spreadsheet

Zoom Chart Excel spreadsheet allows the user to zoom and scroll scatter plot charts and navigate the data more easily. It's available as a spreadsheet and also as an Excel add-in (which allows to use the tool on all your spreadsheets).

I use it every time I need to get into the details of my test results.

Version: 1.4
Date of release: 28/05/2018
Compatibility: See release notes below

Available downloads (click to download):

Add-in installation

After downloading the add-in, save it into a local folder. Then follow the instructions of the video shown here.

The add-in will appear as a separate tab in Excel. Clicking on the button "Open zoom chart" will activate the zoom chart tool.

Excel add-in

New free material is regularly created. If you are interested in receiving an email when a new spreadsheet is released you can subscribe to EnginExcel newsletter.

Don’t worry, I want this to be a service to you: I will treat your data very carefully and will not fill your inbox with spam.

Why I created the zoom chart tool

Some time ago I was doing some tests to verify the stability of a weigh cell after the positioning of a component over it. A normal response of a weigh cell would be divided in:

Plot of a weigh cell response, divided into different response areas.
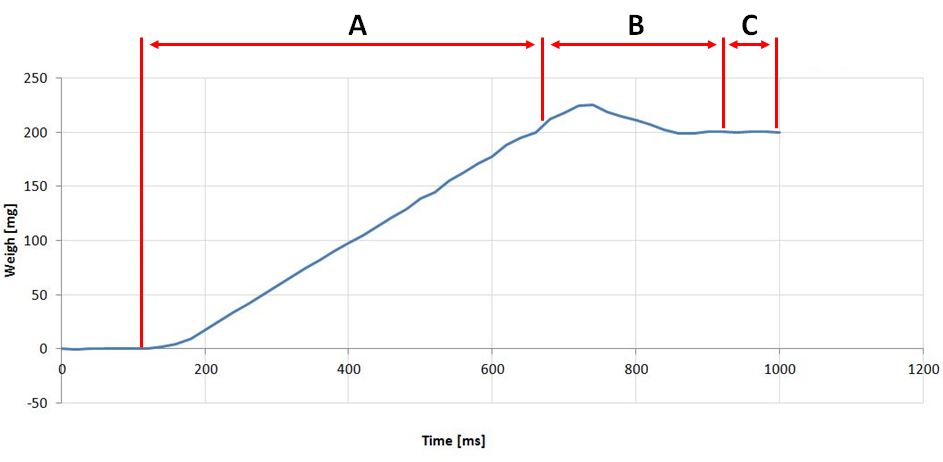
  1. Weigh raising time: the period when the weigh is raising because the component has been put over the weigh cell
  2. Settling time: the period when the weigh cell has reached the correct weight, but its value is still oscillating
  3. Steady time: the period when the transient is concluded and the weigh cell has reached a value that is within a certain acceptable error range
 

My target was to measure the time needed for weighing, so the time that passed between the positioning of the component on the weigh cell (start of period A) and a steady output (start of period C).

The weigh cell recorded a weigh reading every 20 ms on a csv file. I then imported the readings (time and weigh) on a spreadsheet and created a simple scatter plot chart, as shown in the figure. At this point I wanted to have a closer look at the chart to see how the readings behaved in the period B (e.g. was there an oscillation? Could I understand what caused this oscillation? Could I see the extension of the oscillation and measure it?).

Zoomed plot of a weigh cell response

I quickly discovered that Excel charts are not very easy to navigate, since the user needs to manually change the minimum and maximum values that are shown by the axis. This is quite a long procedure, which slowed the data analysis period a lot.

This is the reason why I decided to create the Zoom chart spreadsheet. It is a simple tool which allows the user to zoom or scroll the scatter plot chart and get a closer look to his data. The speed of the zoom and the scroll can be adjusted depending on the user preferences. It's possible to choose which axis to zoom, which can be quite handy.

The Zoom chart spreadsheet is available as a ready-to-use spreadsheet and also as an Excel add-in. This allows the user to embed the add-in in Excel and open it by just clicking a button. The zoom and scroll functionalities would then be ready to use on every spreadsheet, provided that a scatter plot chart has been created previously.

Zoom chart spreadsheet release notes

Use

EnginExcel free spreadsheets are free for personal and commercial use.

Compatibility

Zoom chart spreadsheet is tested on Microsoft Excel 2007, 2010, 2013 and 365 for Windows. Microsoft Excel for Mac is currently not compatible.

Activation

To activate the functionalities of the spreadsheet you may need to click on Enable editing and Enable content after opening it for the first time.

Features
  • Works with all Excel scattered plots
    • Possible to add multiple scattered plots
  • Chart zoom
    • Allows selection of which axis to zoom
    • Allows to define the speed of the zoom
  • Chart scroll
    • Allows to scroll up/down/left/right
    • Allows to define the speed of the scroll
  • Reset view button
  • Excel Add-in available
Instructions
Operation How to
How to activate the zoom/move tool - Click on the chart area (the white area around the chart)
- Click on the button "Start chart navigator"
How to move the chart - Activate the zoom/move tool
- Define the movement speed (use the scroll bar or type a number between 1 and 99 - the higher the number the higher the movement speed)
- Click on one of the movement buttons (Up/down/left/right)
How to zoom the chart - Activate the zoom/move tool
- Define the zoom speed (use the scroll bar or type a number between 1 and 99 - the higher the number the higher the zoom speed)
- Click on one of the zoom buttons (In/out)
How to restore the original zoom and position of the chart - Activate the zoom/move tool
- Click on "Reset view"
Terms of use

EnginExcel free spreadsheets are free for personal and commercial use, but it may not be altered or sold without the written permission of the author.

Disclaimer

EnginExcel free spreadsheets may be freely distributed, provided that no charge above the cost of distribution is levied, and that the terms of use and disclaimer are always attached to it. EnginExcel free spreadsheets are provided as is without any guarantees or warranty.

Although the author has attempted to find and correct any bugs in the spreadsheets, the author is not responsible for any damage or losses of any kind caused by the use or misuse of the spreadsheets.
The author is under no obligation to provide support, service, corrections, or upgrades to the spreadsheets.
For more information, please send an email to the author (see contacts on this page).

Any comments?

If you have any comments on this material I’ll be happy to receive your feedback. You can contact me here.

If you enjoy this free material but would like to have it customised for your needs feel free to contact me.